Those who are familiar with Conditional Formatting feature of Excel would appreciate the enhancement made in Excel 2007 comparatively to Excel 2003. Conditional formatting is very effective when you are looking at one instance of the data. But what if you are trying to see a Even better feature called Sparklines are introduced in Excel 2010
Sparklines are a great new addition in Excel 2010. These are effectively charts that can fit in a cell that allows you to easily analyze your data.
Following are some samples of Sparklines:


As you see from above figures how easily you can analyze data Monthly, Quarterly or Annually.
You can even highlight the High points or low points in different colours.
There are mainly three types of Sparklines: Line, Column and Win/Loss
To create spraklines please follow these steps:
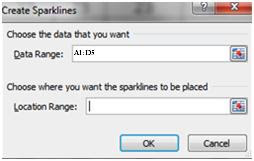
Step 1: Select all the data you wish to create the sparklines for. In our example mentioned above the selected data would be A1: D5.
Step 2: Choose Insert on the ribbon. Select the sparkline of your choice i.e. Line, Column or Win/Loss

Step 3: In the Create Sparklines dialog box select the location range by selecting the cells where you would like to place the sparklines. In our examples above it will be E1: E5.
 Step 4: Press OK
I hope you enjoyed this article and would strongly advice you to got to MTC website to get free downloadable course manuals for any of the office packages and other products. Please click Free Manuals Link to directly go to the free manuals section. Course manuals for Office 2010 will be available in the near future.
No comments:
Post a Comment